Are DfE adjustments to extremely low progress scores unfair?
FoI request shows some pupils are 30 times more likely to have their scores adjusted than others
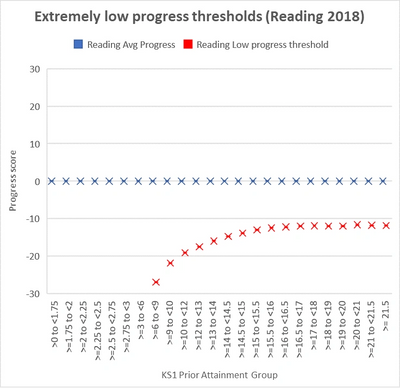
As soon as the DfE published the technical guidance relating to their new methodology for adjusting the "extremely low progress scores" that some children generate at KS2, the alarm bells started ringing. On the face of it, it seems a reasonable and positive attempt to ameliorate the impact that individual children's very low scores can have on the overall score for the school. We've all seen examples where one child's very low progress score has meant that a school's overall progress is described as below average. The DfE's guidance states that "about 1%" of children nationally will have had their scores adjusted, but they also state that rather than simply adjusting the scores of the lowest 1% of children nationally, they used standard deviation calculations for each of the prior attainment groups (PAGs) at KS1 to identify which children's scores to adjust. The effect of these calculations means that NO children with prior attainment of less than 6pts at KS1 could have their scores adjusted, because the theoretical thresholds set by these calculations were, in fact, lower than the lowest possible score a child could achieve! Not only this, but the thresholds for the prior attainment groups covering children with a KS1 APS of 6-12pts were much lower than those of children with above-average prior attainment at KS1. So, instead of getting a straight line threshold, we get a very strange looking curve, as illustrated in the chart on this page. For example, the threshold in Reading for a child with a KS1 APS of 7pts is -27.06, while the threshold for a child with a KS1 APS of 21pts is only -11.55.
This apparently bizarre and unnecessarily complicated approach to setting the thresholds made me wonder whether it had been done in order to ensure that roughly equal numbers of children from across the prior attainment spectrum benefited from the adjustment. The DfE hadn't provided any figures relating to the numbers of children in each PAG who have had their scores adjusted as a result of this methodology, so the only way to find out was to submit a Freedom of Information request...
... after a few weeks of waiting, the response arrived, and the information provided is rather shocking. The total numbers of children across country in the first 8 PAGs are relatively small so let's take the 22,118 children in the PAG which covers >=9-<10 pts at KS1 as our first example. In Reading, only 52 of these children had their scores adjusted: that's just 0.2% of the group. In contrast, 527 of the 40,591 (1.3%) children in the PAG that covers >=15.5 to <16pts at KS1 had their scores adjusted. That means that a child in this PAG is 6 and a half times more likely to have their score adjusted than a child in the lower PAG.
The situation is similar in Maths, but the really extreme variations occur in Writing. Only 17 (0.1%) of the children from the PAG which covers >=9-<10 pts at KS1 had their scores adjusted compared to 1777 (3.3%) from the PAG which covers >=17-<18 pts at KS1. That means that a child in this PAG is 33 times more likely to have their score adjusted than a child in the lower PAG!
On top of this, we also need to consider the fact that the adjustments for children in lower PAGs can only be very minor because their thresholds are so low, while a child in a higher PAG can receive a very considerable adjustment because their thresholds are much closer to zero.
This all points to a system which is weighted against children with lower prior attainment. We can only speculate as to whether this has been done intentionally. It could also be argued that this approach is also unfair for those schools which have lots of children with low prior attainment. We need to recognise that some children with low prior attainment often make excellent progress, but these children often have English as an additional language: my fear is that the schools which will suffer the most from this approach are those with high proportions of non-EAL children from deprived backgrounds, many of whom have SEN and low prior attainment at KS1.
If you're interested, the spreadsheet containing the detailed figures from the FoI request can be downloaded below.